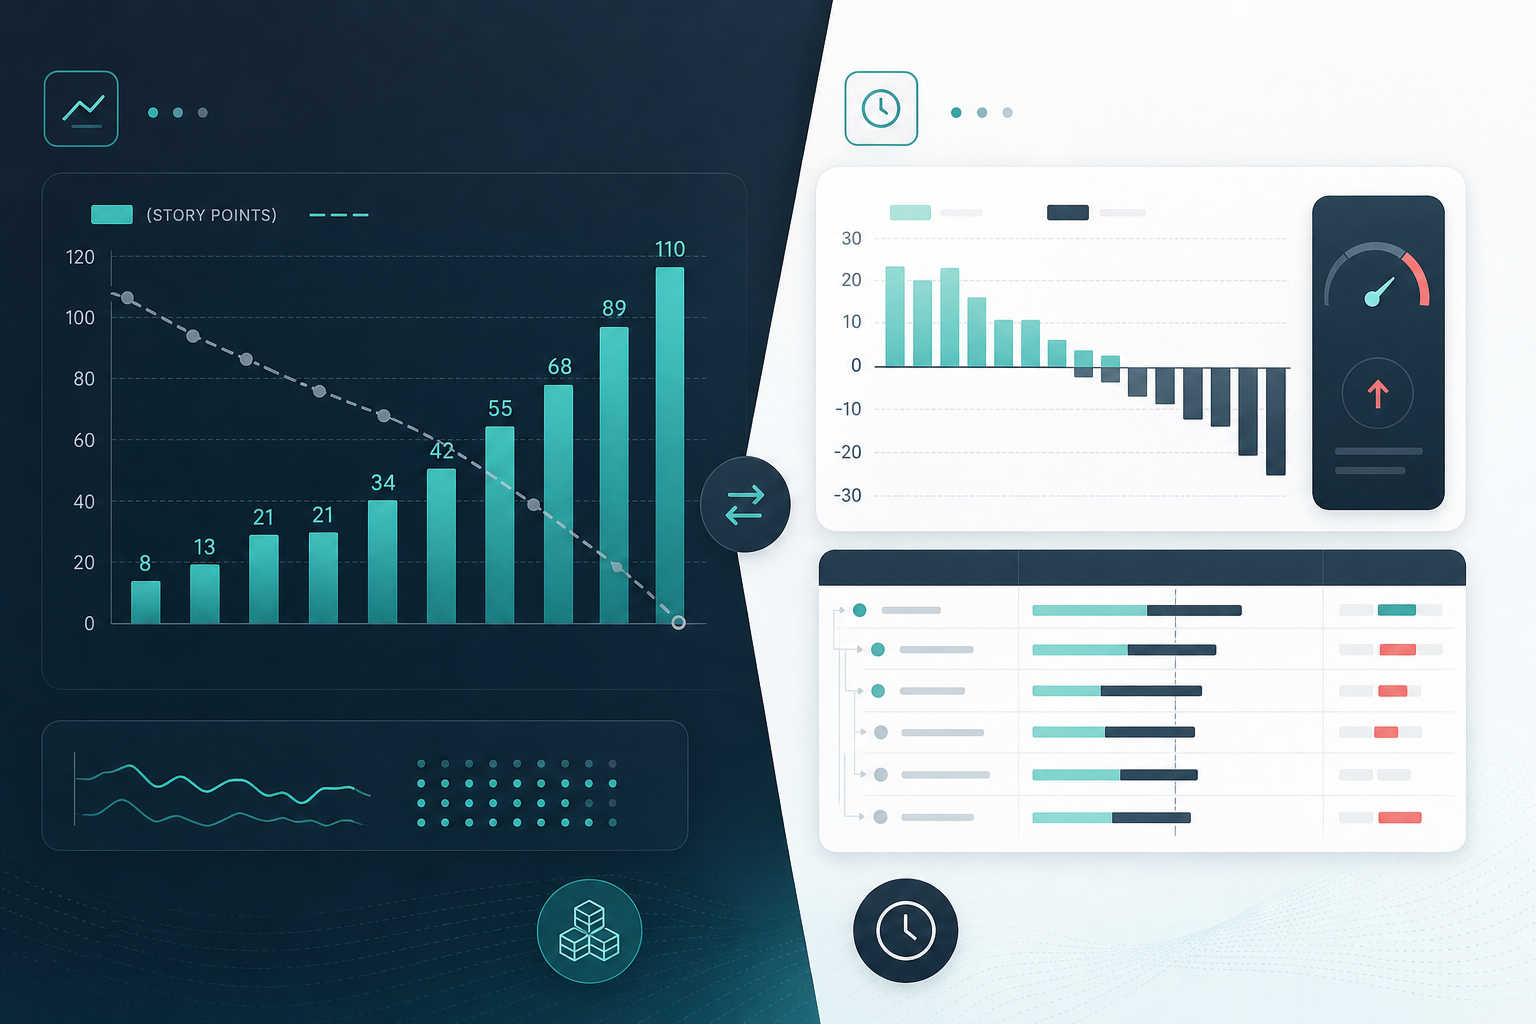
The velocity chart looked healthy.
Three sprints in a row, the team completed more story points than they forecast. The burndown flattened on schedule. In the sprint review, the agile coach could point to stable throughput and a backlog that still looked achievable.
Then the project sponsor opened a different conversation:
"We approved 400 hours for this release. Velocity looks fine — so why are we already 60 hours over budget?"
Nobody had a clean bridge answer. Someone opened Jira velocity again. It still described sprint throughput in story points. It did not explain Jira budget reporting in hours, variance, and child-issue drivers.
Agile coaches and scrum masters own the throughput view. Project managers often translate it for sponsors who listen for hour-based evidence. This how-to explains what Jira velocity actually tracks, why it is not a budget report, and what to show stakeholders instead.
For sprint chart context, see Jira sprint carryover and scope change reporting. For estimation feedback loops, see Why your team will never get better at sprint estimation until you fix this. For subtask blind spots, see Why Jira subtasks make sprint time reports harder than they look. For issue-level warning filters, see Jira planned vs actual reporting.
Quick Answer
Jira velocity answers:
"How much work did we complete per sprint, in our estimation units?"
Jira budget reporting answers:
"Where did estimate, logged time, and remaining work diverge in hours — and which issues explain the variance?"
Those questions overlap in delivery conversations. They are not the same chart.
What You Are Trying to Accomplish
You need one coherent delivery story with two reporting layers:
- Inside the team: use velocity, burndown, and Jira story points reporting to inspect throughput and plan the next sprint.
- Outside the team: use hour-based estimate, logged time, remaining work, variance, and drivers when sponsors, clients, or finance ask about budget.
The goal is not to replace velocity. The goal is to stop velocity from standing in for a budget report it was never designed to provide.
Requirements Before You Start
Confirm these basics before you bridge metrics for a steering meeting:
- You can open the Scrum board's velocity chart, burndown, and sprint report.
- You know the board's estimation statistic — story points, original time estimate, or issue count.
- Time tracking is enabled and the relevant users can log work on the issues that count toward the budget.
- Original estimates exist on the issue level your scope rule uses.
- You have documented which epic, release, or project boundary defines the sponsor's hour budget.
- Everyone agrees whether subtask estimates and worklogs are in or out of the hours story.
Without those rules, Jira velocity vs hours debates become arguments about charts that are measuring different things correctly.
Quick Decision Flow
- If the audience cares about sprint throughput and capacity → start with the velocity chart, burndown, and sprint report.
- If the audience cares about approved hours, cost, or forecast variance → add original estimate, time spent, remaining estimate, and driver breakdown — velocity alone is not enough.
- If velocity looks stable but sponsors keep asking about hours → check whether the board uses story points while budgets are tracked in time fields.
- If the board estimates in time but sponsors still need epic- or project-level totals → velocity shows sprint throughput, not a stakeholder rollup — export or roll up separately.
- If the same hour rollup is rebuilt every sprint in Excel → evaluate JQL exports, work-ratio filters, or rollup tools — not another velocity view by default.
Velocity vs Hours Budget Reporting
| Dimension | Jira velocity and story points reporting | Hour-based budget reporting |
|---|---|---|
| Primary question | "How much work did we complete per sprint?" | "Where are we over or under estimate in hours?" |
| Typical audience | Scrum team, agile coach, delivery lead | Project sponsor, client PM, finance partner |
| Main signals | Committed vs completed estimation units, throughput trend | Original estimate, time spent, remaining estimate, variance |
| Native home | Velocity chart, burndown, sprint report | Issue time panel, JQL, exports, planning rollups |
| Units | Story points, time, or issue count — per board config | Hours from Jira time tracking fields |
| Subtask estimates | Not included in velocity chart per Atlassian docs | Depends on scope rules and rollup path |
| Best use | Capacity planning, forecasting, retrospectives | Budget check-ins, steering updates, overrun explanations |
This table is a question split, not a verdict on Jira reporting quality.
What Jira Velocity Actually Measures
The velocity chart compares forecasted and completed work across sprints. Atlassian positions it as a way to help teams forecast future capacity as more sprint data becomes available.
The important detail for budget conversations: velocity uses the board's estimation statistic.
Many teams configure story points. Others use original time estimate or issue count. The chart follows that configuration. It measures completed estimation units per sprint — not logged hours from worklogs.
Even when the estimation statistic is time, velocity still describes sprint throughput of those estimates. It does not replace a rollup of actual time spent, remaining estimate, and variance across the sponsor's scope.
Atlassian describes estimation in Jira as a way to assess backlog size and infer reasonable completion dates by comparing initial estimates with average work completed per sprint.
That is a forecasting metric. It is not a ledger of hours consumed.
Subtasks create another split. Atlassian documentation cited across existing site articles notes that sub-task estimates are not included in the velocity chart calculation. If effort grows on subtasks while parent stories look stable, velocity can describe parent-level flow while the hours story lives underneath.
Board scope matters too. Velocity charts are board-specific. They only include work matching the board's saved filter. A sponsor's budget line may span an epic, release, or project that does not map cleanly to one board.
Why Velocity and Burndown Do Not Answer Budget Variance
The burndown chart shows actual and estimated work remaining during a sprint — again in the board's estimation units.
For sprint ceremonies, velocity and burndown are valuable. They show whether the team is finishing committed work and maintaining throughput.
They do not, by themselves, answer:
"Of the hours we approved, where did we go over — and which work explains it?"
Three common gaps drive the confusion.
Story points are not hours
Story points are relative sizing. Teams use them to compare effort within a backlog, not to invoice a client or defend an approved hour budget.
A sprint can complete 34 story points and still consume more hours than planned if the work was harder, carried hidden subtask effort, or included support work that never entered the original estimate conversation.
Do not present an informal points-to-hours ratio to finance unless the team documents it as a planning assumption — and even then, treat it as a forecast helper, not proof of budget status.
Presenting Jira velocity as proof of budget health without an hours bridge creates confusion — especially when stakeholders hear "we delivered everything we committed" and assume that means "we stayed inside the hour budget."
Throughput can improve while variance grows
Velocity compares completed estimation units across sprints. Budget variance compares logged time and remaining work against an original estimate baseline.
Those trends can diverge. A team can increase point throughput while individual issues run over their hour estimates. Velocity will not surface that when the board estimates in story points.
Sprint scope is not always the budget boundary
Velocity and burndown are sprint and board views. Budget conversations often span epics, releases, client milestones, or multiple boards.
See Why your Jira epic always shows 0 hours when the sponsor's question is epic-scoped but the agile metrics are sprint-scoped.
Step-by-Step: Bridge Velocity and Hour-Based Reporting
Step 1: Name the two questions explicitly
Before any steering meeting, write both questions on the slide or agenda:
- Team question: "Are we maintaining throughput and completing committed sprint work?"
- Sponsor question: "Are we inside the approved hour budget, and what explains any variance?"
That prevents the velocity chart from silently standing in for a budget report.
Step 2: Confirm what the board estimates in
Check the Scrum board configuration:
- Is the estimation statistic story points, original time estimate, or issue count?
- Does time tracking use original estimate, remaining estimate, or both?
- Are worklogs on parent issues, subtasks, or both?
If the board plans in points but the budget baseline is hours, you need a translation layer — not an assumption that velocity equals hours.
Step 3: Prepare the hour story before the meeting
Build the sponsor answer from Jira time fields:
- Original estimate — the baseline
- Time spent — hours logged in worklogs
- Remaining estimate — forecast of work left, when your process uses it
- Variance — spent and forecast against the baseline
- Drivers — the stories, subtasks, bugs, or support work that explain the gap
Atlassian's time tracking documentation says logging time lets teams compare the original estimate with the actual time taken.
Spent variance:
time spent - original estimate
Forecast variance when remaining estimate is maintained:
time spent + remaining estimate - original estimate
See original estimate vs time spent in Jira for why spent variance alone can miss early warnings.
Step 4: Keep velocity in its lane — and give sponsors a talk track
Use the velocity chart for capacity and Jira story points reporting inside the delivery team.
Use hour rollups, JQL exports, or planning views for Jira budget reporting with sponsors.
Example talk track:
"Velocity measures how many story points we complete per sprint — that tells us whether throughput is stable. It does not tell us whether we are inside the approved hour budget. For hours, here is the estimate, logged time, remaining work, and the issues driving variance."
Example combined narrative:
"Velocity stayed near 32 points for three sprints, so throughput is stable. On hours, we planned 400 for this release slice, have logged 312, and still forecast 98 remaining — forecast variance is +10 hours. The gap is concentrated in AUTH-14 and three QA subtasks under PAY-22."
That respects both audiences without pretending one chart answers both.
Step 5: Document the scope rule
Write down what counts toward the hour budget:
- Which epic, project, or release boundary?
- Are subtasks included?
- Are bugs added mid-release inside or outside the baseline?
- Does the board filter match the sponsor scope?
Without that rule, velocity and hour totals can both be "correct" and still disagree.
Common Pitfalls When Presenting Velocity to Sponsors
Avoid these patterns in budget conversations:
- Showing the velocity chart alone when the sponsor asked about approved hours.
- Converting story points to hours with an undocumented team ratio.
- Treating "committed points completed" as "under budget."
- Ignoring subtask worklogs because velocity focuses on parent estimates.
- Using sprint throughput to answer an epic- or release-level budget question.
- Rebuilding the hour rollup live in a spreadsheet while the meeting waits.
If the spreadsheet appears every sprint, the process is telling you the hour story is not visible enough in Jira — not that velocity is broken.
Validate Before You Present Velocity as a Budget Answer
Before an agile coach or project manager shows velocity to hour-based stakeholders, confirm:
- The velocity chart's estimation statistic is named on the slide — points, time, or issue count.
- The hour budget baseline is defined separately from sprint commitment.
- Original estimates exist on the issues in the sponsor scope.
- Time spent and remaining estimate are current on the issues that drive variance.
- Subtask worklogs are included or excluded consistently with the scope rule.
- The board filter matches the budget boundary — or you have a documented reason it does not.
- You can name the top three driver issues if variance is positive — without opening a new export mid-meeting.
If any item fails, fix the narrative before the meeting — not during it.
Mid-Sprint Checklist Before a Budget Meeting
If sponsors will ask about hours, inspect both throughput and variance mid-sprint:
- Velocity trend vs prior sprints — useful for the team narrative.
- Work added after sprint start — visible in the sprint report.
- Issues with logged time but no original estimate.
- Issues where
workRatiois above 80 or 100 — see Jira planned vs actual reporting. - Work logged on subtasks while velocity focuses on parent story points.
- Done issues that still carry remaining estimate.
- Work outside the board filter that still counts toward the sponsor scope.
Then ask:
"If we overrun the approved hours, which issues will explain it?"
If that answer requires a manual export before you can speak, velocity is not your budget report.
Native Paths for Hour-Based Reporting
Before adding tooling, use native Jira paths that complement velocity:
Release- or project-scoped JQL with time columns
fixVersion = "Release 4.2" AND timeSpent > 0
Add original estimate, time spent, and remaining estimate columns, then export and aggregate. See Can JQL show time spent in Jira?.
Work-ratio filters
project = PAY AND workRatio > 100
Useful for finding issues already over original estimate. Still issue-level, not a full stakeholder rollup.
Search exports
Atlassian documents search exports to CSV, Google Sheets, and Microsoft Excel.
Jira Plans rollups
On Premium and Enterprise, Plans roll up estimates for planning conversations. See Jira Plans rollups vs project reporting.
When Native Jira Is Enough
Velocity and native hour checks may be enough when:
- Stakeholders track sprint commitment, not hour budgets.
- The board estimation statistic and budget baseline align — or the team accepts manual exports for the hour layer.
- Estimates and worklogs live on the same issues velocity includes.
- Subtasks are not carrying hidden effort.
- Hour variance checks are occasional, not weekly steering-deck requirements.
In that case, improve the bridge narrative: keep velocity for the team, add a repeatable hour export for sponsors, and document the scope rule.
When Rollup Visibility Is the Next Layer
If velocity keeps answering "how is throughput?" while sponsors keep asking "where are we over on hours for this epic or project?", the gap is rollup visibility — not another velocity chart.
TimePillar public materials position live project and epic rollups of estimated vs logged time, variance, percent of budget used, child-work visibility, and PDF/CSV export from the Jira issue sidebar. The product page states it reads native Jira time-tracking fields and does not use a separate data store — verify in trial and on the Marketplace Privacy & Security tab.
At the time of prior verified research on this site (June 2026), the TimePillar Marketplace listing described Jira Cloud rollups; the product page also mentions Data Center — verify your hosting path before rollout. Prior public-source review on this site did not find support for remaining-estimate rollups at parent scope; verify in trial if forecast variance matters.
TimePillar is not velocity reporting. It addresses epic- and project-level hour rollups when throughput charts answered capacity but the steering deck still needs defended totals.
Evaluate TimePillar when the recurring question is:
"Velocity looks stable — can I open this epic or project and defend estimate, logged time, variance, and child breakdown without rebuilding a spreadsheet?"
For category context, see The 5 Jira time reports every project manager asks for and TimePillar vs Jira time tracking Marketplace apps.
Give Each Metric Its Job
Jira velocity earns its place in agile delivery. It helps teams forecast capacity, inspect throughput, and improve Jira story points reporting over time.
It does not, by itself, answer Jira budget reporting questions in hours — especially when the board estimates in points, subtasks carry the effort, and sponsor scope spans more than one sprint chart.
Two metrics. Two audiences. One coherent narrative when agile coaches and project managers bridge them deliberately.
When throughput and budget variance keep diverging, see how TimePillar Jira reporting helps teams bring estimate, logged time, variance, and rollup visibility closer to the stakeholder conversation — after velocity has done its job.