Diagram Lens-safe scope
These examples use plain Mermaid source, stable labels, static diagrams, and renderer-owned security settings. The guide avoids source-defined interactivity and raw markup patterns so teams can use the examples in Confluence with fewer surprises.
1. Pick the right chart type
Most hard-to-read Mermaid diagrams start with the wrong diagram type. Use a flowchart for process logic, but switch types when the question is about time, data relationships, infrastructure, or request order.
| Goal | Mermaid type | Best fit |
|---|---|---|
| Business or system flow | flowchart | Branches, decisions, ownership, and process steps. |
| API behavior | sequenceDiagram | Request order, responses, async work, retries, and failures. |
| Data model | erDiagram | Entities, cardinality, and relationships. |
| Project schedule | gantt | Dates, dependencies, milestones, and critical work. |
| Infrastructure | architecture-beta | Services, resources, and deployment boundaries. Verify renderer support for beta syntax. |
| Layout-sensitive overview | block-beta | Simple layered layouts where flowchart auto-layout is too loose. Verify renderer support for beta syntax. |
| Planning outline | mindmap | Documentation outlines, workshops, and feature breakdowns. |
2. Use stable IDs and readable labels
Use short stable IDs for Mermaid nodes, and put human-readable copy in labels. This makes diagrams easier to style, refactor, search, and edit with AI tools.
flowchart LR
    api["Public API"] --> db["PostgreSQL Database"]
For larger diagrams, use prefixes that describe the role of each node. Labels can change later without breaking edges or styles.
flowchart LR
    actor_user["Customer"]
    system_api["Public API"]
    db_orders[("Orders DB")]

    actor_user --> system_api --> db_orders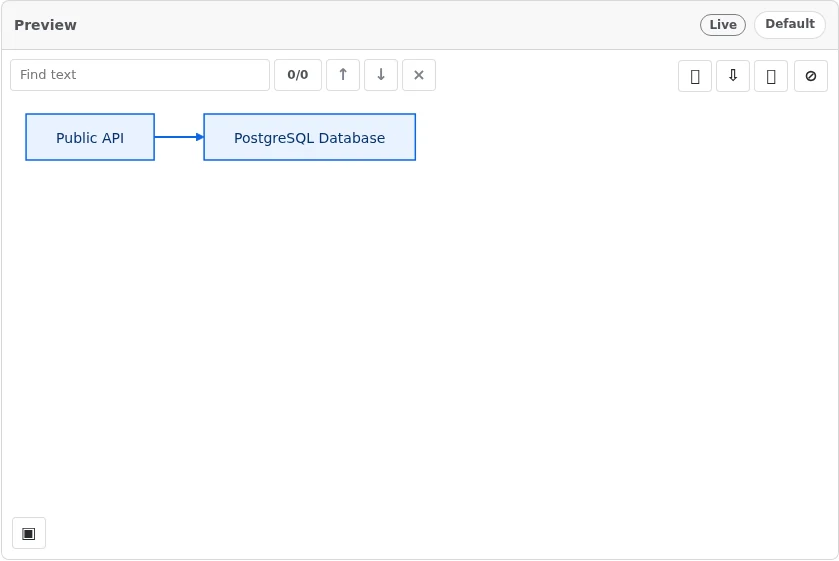
3. Use subgraphs for boundaries
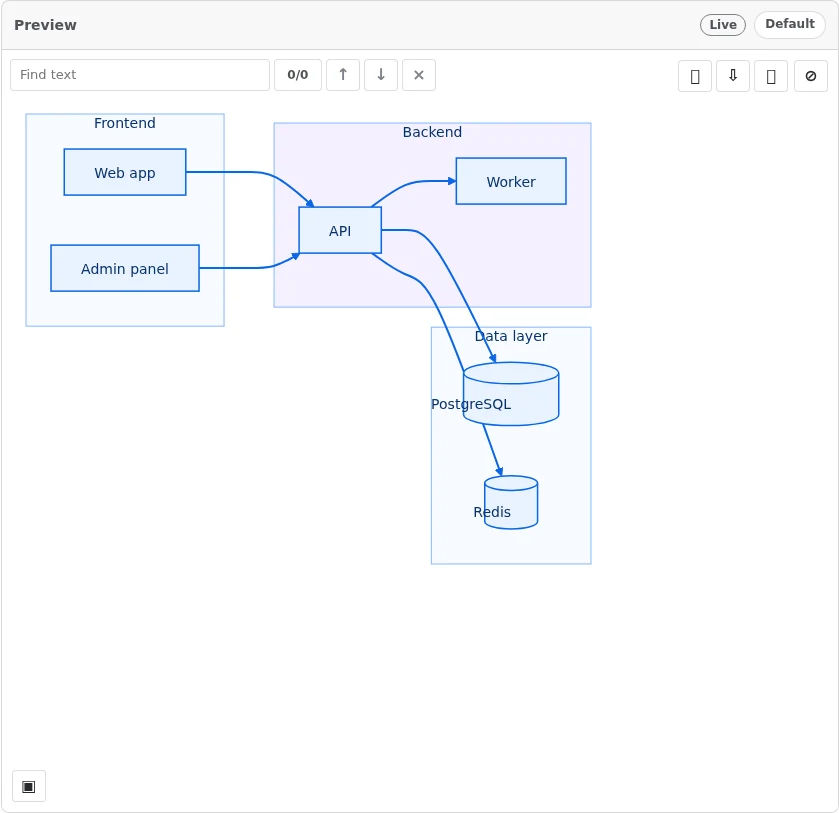
Subgraphs are useful when a diagram needs ownership, system, environment, or phase boundaries. Use them to clarify responsibility, not as decoration.
flowchart LR
    subgraph frontend["Frontend"]
        web["Web app"]
        admin["Admin panel"]
    end

    subgraph backend["Backend"]
        api["API"]
        worker["Worker"]
    end

    subgraph data["Data layer"]
        db[("PostgreSQL")]
        cache[("Redis")]
    end

    web --> api
    admin --> api
    api --> worker
    api --> db
    api --> cache
Keep the boundary labels business-readable. If you need deeply nested subgraphs, split the diagram into overview and detail diagrams instead.
4. Control spacing and avoid syntax traps
Mermaid auto-layout can place nodes closer than you want. Longer links add distance and can make a dense diagram easier to scan.
flowchart TD
    start["Start"] --> step1["Step 1"]
    step1 ----> step2["Step 2 farther away"]
    step2 --> done["Done"]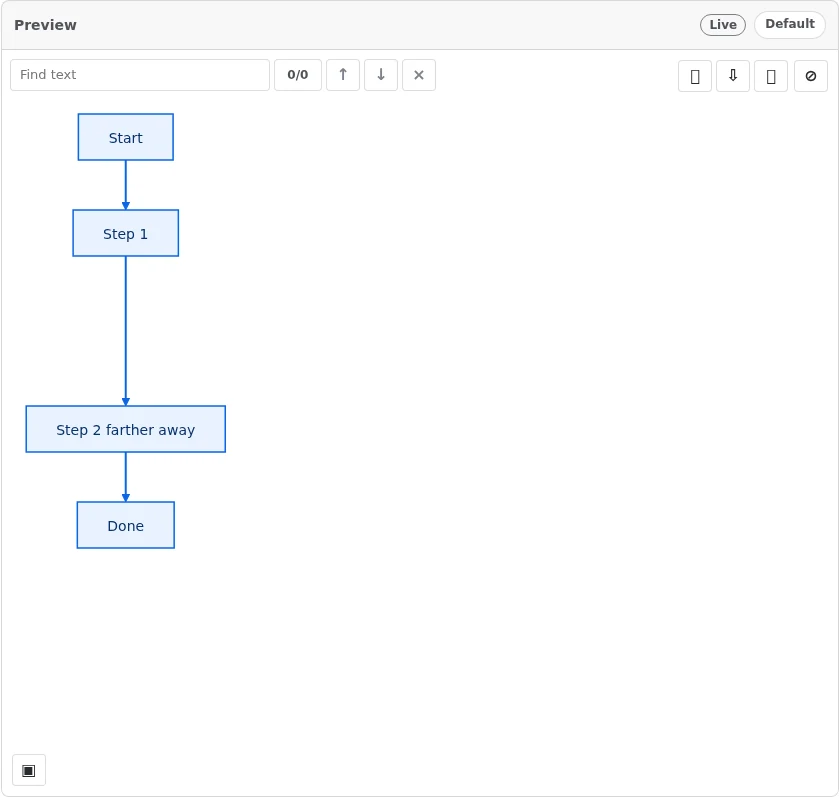
Quote labels when text might be confused with Mermaid syntax. This is especially useful for words like end, labels with punctuation, labels with brackets, and values that start with special edge markers.
flowchart TD
    start["Start"] --> end_node["End"]
    end_node --> xray["x-ray check"]
xray --> hash["Use #35; if a hash symbol breaks rendering"]- Use
flowchart TDfor most workflows and decision trees. - Use
flowchart LRfor architecture and request-flow diagrams. - Use quoted labels when the text contains punctuation or Mermaid keywords.
- Keep label text plain when the diagram must render consistently across tools.
5. Style meaning, not decoration
Use classDef when color communicates a category such as internal service, storage, external dependency, critical path, or deprecated component. Too many colors make diagrams harder to read.
flowchart LR
    api["API"]
    db[("Database")]
    cache[("Redis")]
    payment["Payment provider"]

    api --> db
    api --> cache
    api --> payment

    classDef service fill:#e8f0ff,stroke:#3157a4,stroke-width:1px;
    classDef storage fill:#f7f7f7,stroke:#555,stroke-width:1px;
    classDef external fill:#fff8dc,stroke:#b8860b,stroke-width:1px;

    class api service;
    class db,cache storage;
    class payment external;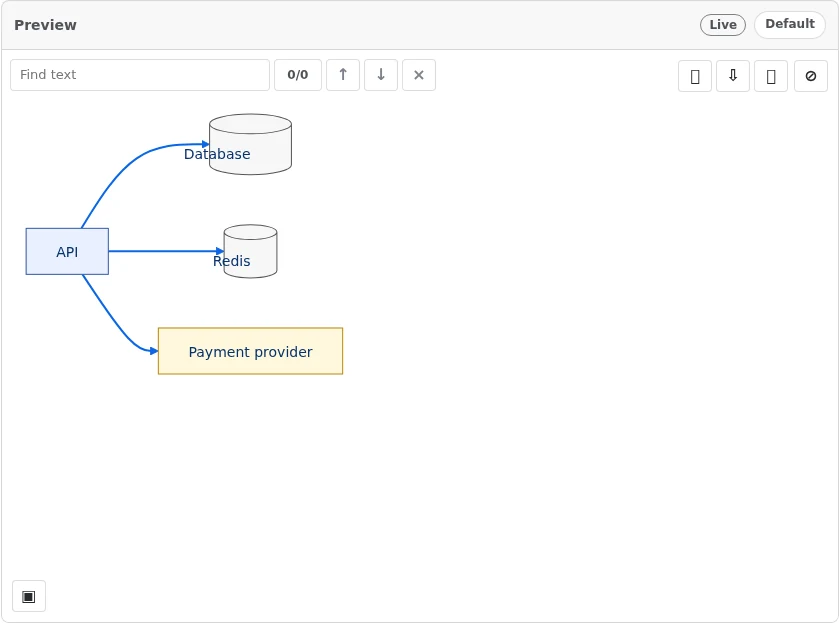
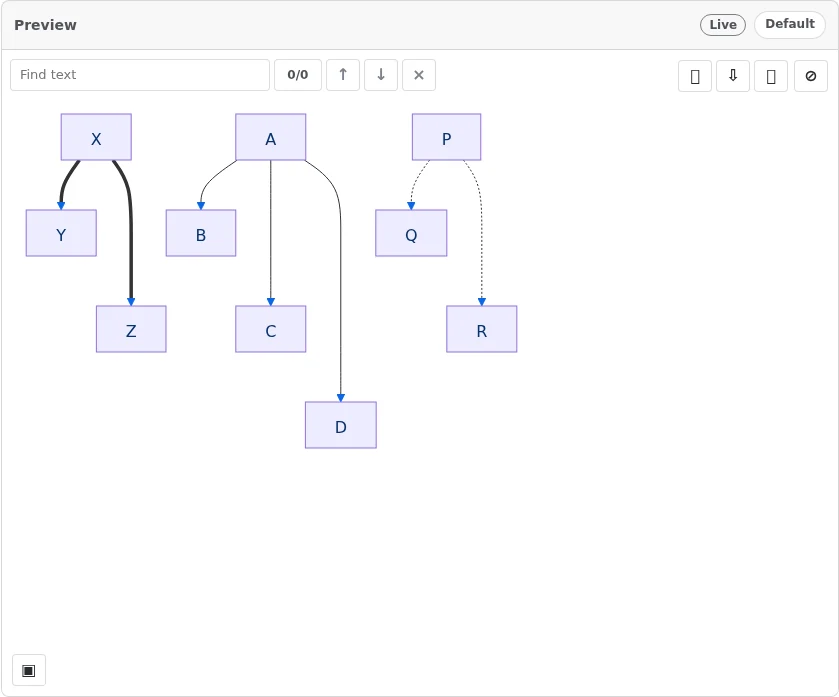
linkStyle can highlight a special path, but it depends on edge order. Use it sparingly and add a comment near the diagram source so future editors know which edge is being styled.
flowchart LR
    A["API"] --> B["Primary DB"]
    A --> C["Cache"]
    A --> D["Fallback service"]

    %% Link 2 is the fallback path.
    linkStyle 2 stroke:#c00,stroke-width:2px,stroke-dasharray: 5 5;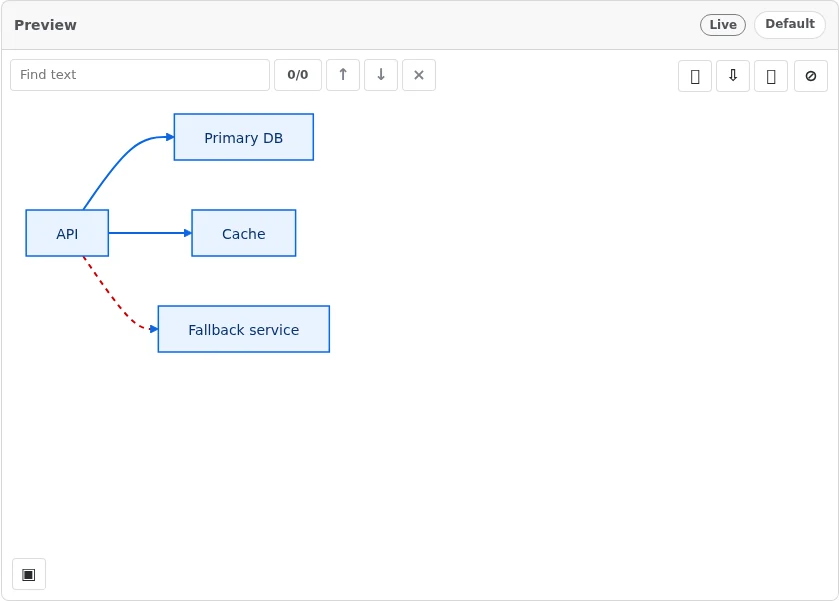
6. Use sequence diagrams for APIs
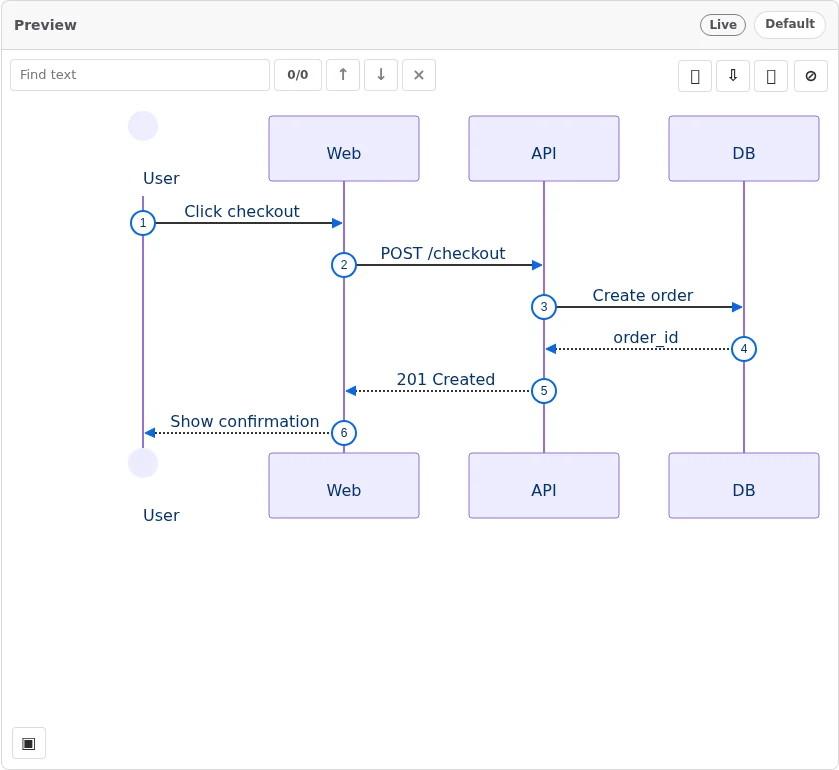
If the diagram explains who calls whom and in what order, use sequenceDiagram. It communicates request/response behavior more clearly than a flowchart.
sequenceDiagram
    autonumber
    actor User
    participant Web
    participant API
    participant DB

    User->>Web: Click checkout
    Web->>API: POST /checkout
    API->>DB: Create order
    DB-->>API: order_id
    API-->>Web: 201 Created
    Web-->>User: Show confirmation
Use autonumber when reviewers need to discuss exact steps during design review, support triage, or incident analysis.
7. Use data and architecture diagrams when boxes and arrows are not enough
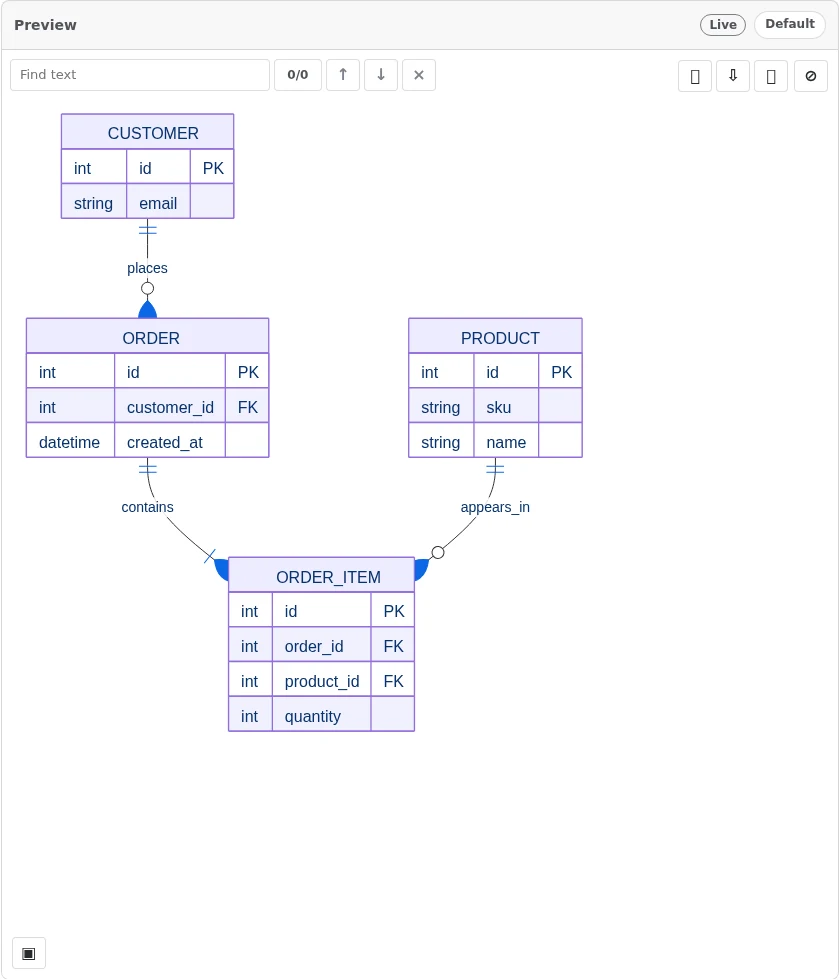
Use erDiagram when the important detail is entity relationship and cardinality. For logical models, avoid repeating every database field if the relationship already communicates the point.
erDiagram
    CUSTOMER ||--o{ ORDER : places
    ORDER ||--|{ ORDER_ITEM : contains
    PRODUCT ||--o{ ORDER_ITEM : appears_in

    CUSTOMER {
        int id PK
        string email
    }

    ORDER {
        int id PK
        int customer_id FK
        datetime created_at
    }
Use architecture-beta for infrastructure and deployment sketches when your target renderer supports it. Keep beta syntax behind a quick render check before sharing the page broadly.
architecture-beta
    group public_api(cloud)[Public API]
    service gateway(internet)[Gateway] in public_api
    service app(server)[App Service] in public_api
    service db(database)[Postgres]

    gateway:R --> L:app
    app:R --> L:db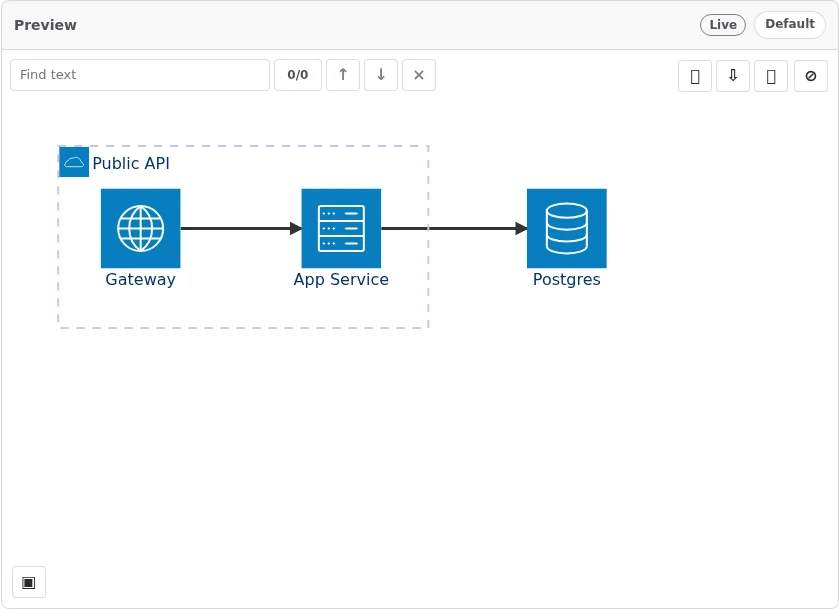
8. Keep large diagrams readable
Diagram Lens gives Confluence users wide view, zoom, search, minimap navigation, and export tools, but the best diagram is still focused. Split diagrams before they require constant zooming to understand the main point.
| Symptom | Better approach |
|---|---|
| More than 15 to 25 nodes | Create an overview diagram and separate detail diagrams. |
| Many crossing arrows | Split by phase, module, service boundary, or ownership. |
| Too many colors | Reduce classes or add a small legend. |
| Mixed process, data, and deployment details | Use separate flowchart, ER, and architecture diagrams. |
A good documentation set often uses several small Mermaid files:
01_context.mmd
02_request_flow.mmd
03_data_model.mmd
04_deployment.mmd
05_release_plan.mmd
9. Add accessibility metadata and useful comments
Add accTitle and accDescr for diagrams shared in documentation. Comments are also useful when they explain why the diagram is structured a certain way.
flowchart LR
    accTitle: Order processing flow
    accDescr: Customer order moves from checkout to validation, payment, and fulfillment.

    %% External actor
    customer["Customer"]

    %% Internal systems
    api["API"]
    erp["ERP"]

    customer --> api --> erp
Do not comment every obvious node. Good comments explain grouping, styling, ownership, and non-obvious tradeoffs.
10. Use LLM-friendly naming
If a team uses AI tools to draft or revise Mermaid source, predictable IDs make edits safer. Prefer lowercase names with role prefixes.
flowchart LR
    actor_user["User"]
    system_api["API"]
    db_orders[("Orders DB")]

    actor_user --> system_api
    system_api --> db_orders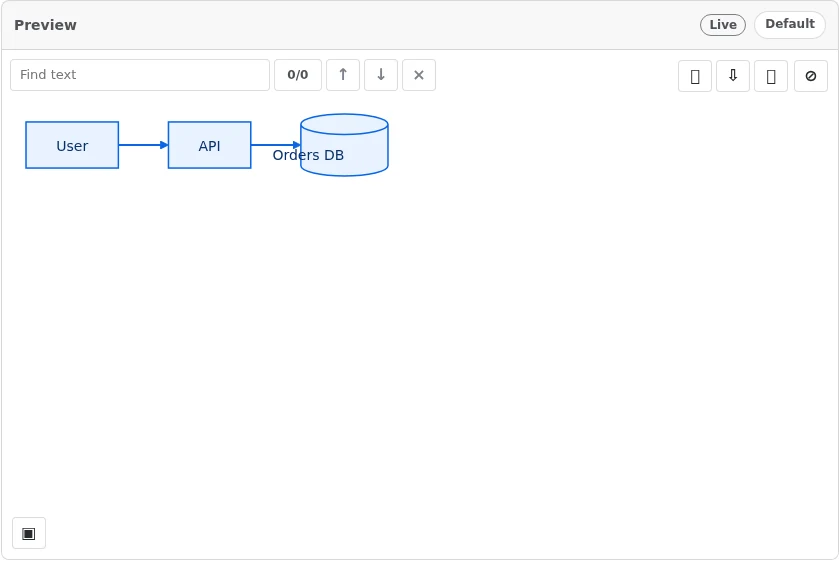
Useful prefixes include actor_, system_, service_, db_, queue_, and external_. This lets you ask for precise edits, such as:
Add Redis between
system_apianddb_orders.
Prompt template
Use this prompt when asking an AI assistant to create a Mermaid diagram for Diagram Lens:
Create a Mermaid diagram for Confluence documentation.

Rules:
- Pick the correct Mermaid diagram type instead of using flowchart for everything.
- Use stable lowercase snake_case IDs.
- Keep readable labels separate from IDs.
- Use subgraphs for major ownership, system, environment, or phase boundaries.
- Add accTitle and accDescr when supported by the diagram type.
- Use classDef only when styling communicates meaning.
- Keep the diagram focused on one idea.
- Prefer several small diagrams over one unreadable diagram.
- Use plain labels and static documentation-friendly Mermaid source.
For a complete worked example, follow our guide to generating a Mermaid diagram from requirements with AI. It pairs a reusable prompt with a six-rule register and a checked diagram.